


Understanding Moving Averages for Bitcoin Price: A Comprehensive Guide
With the volatile nature of cryptocurrency markets, analyzing price trends is crucial for traders and investors. In 2024, Bitcoin saw significant fluctuations, and understanding moving averages for Bitcoin price can provide valuable insights into market trends. In this article, we’ll break down everything you need to know about moving averages, their types, calculation methods, and how to effectively incorporate them into your trading strategies.
What are Moving Averages?
Moving averages (MAs) are one of the most widely used indicators in technical analysis. They help smooth out price data by creating a constantly updated average price. This makes it easier to identify the direction of the trend. In the context of Bitcoin price, moving averages serve as dynamic support and resistance levels.
- Simple Moving Average (SMA): The average price of Bitcoin over a specified number of days.
- Exponential Moving Average (EMA): Similar to SMA but gives more weight to recent prices, making it more responsive to new information.
Types of Moving Averages
There are several types of moving averages traders utilize in their analysis. The two most common types are:
1. Simple Moving Average (SMA)
The SMA is calculated by adding the closing prices of Bitcoin over a period and dividing by the number of periods. For example, to calculate a 10-day SMA:
- Add the closing prices of Bitcoin for the last ten days.
- Divide the sum by 10.
This method provides a straightforward approach to identify the average price over the given period. For example, if the recent Bitcoin prices are $40,000, $41,000, and $39,500, the SMA would be:
- SMA = ($40,000 + $41,000 + $39,500) / 3 = $40,166.67
2. Exponential Moving Average (EMA)
The EMA gives more weight to recent prices and reacts quicker to price changes. The formula for calculating EMA involves a bit more math:
- Calculate the SMA for the initial EMA value.
- Use the following formula for each subsequent period:
- EMA = (Current Price x Multiplier) + (Previous EMA x (1 – Multiplier))
- Multiplier = 2 / (N + 1), where N is the number of days.
For instance, if we are calculating a 10-day EMA, the multiplier would be 2 / (10 + 1) = 0.1818.
Why are Moving Averages Important for Bitcoin Traders?
Utilizing moving averages can significantly enhance your trading strategy by:
- Identifying Trend Direction: Moving averages help traders determine if Bitcoin is in an uptrend, downtrend, or sideways trend.
- Generating Buy/Sell Signals: A strategy known as the crossover strategy involves looking for points where the short-term moving average crosses above or below a long-term moving average.
- Providing Support and Resistance Levels: Bitcoin’s historical prices often react around moving average lines, offering potential buy and sell zones.
Getting Started with Moving Averages for Bitcoin Price
To effectively implement moving averages in your trading strategy for Bitcoin, consider the following steps:
1. Choose the Right Time Frame
Depending on your trading style, choose an appropriate time frame for your moving averages:
- Short-Term Traders: Use shorter periods like 5, 10, or 20 days.
- Long-Term Traders: Use longer periods like 50, 100, or 200 days.
2. Analyze Moving Average Crossovers
Watch for crossovers, as they provide signals for potential trades.
- Golden Cross: When a short-term MA crosses above a long-term MA, indicating a potential bullish trend.
- Death Cross: When a short-term MA crosses below a long-term MA, indicating a potential bearish trend.
3. Combine with Other Indicators
To enhance the reliability of signals generated, combine moving averages with other technical analysis tools, such as RSI or MACD.
Real-World Cases of Moving Averages in Bitcoin Trading
Let’s look at the moving averages applied in real-world scenarios for Bitcoin trading:
Case Study: 2024 Market Analysis
In 2024, Bitcoin’s price fluctuated significantly between $30,000 and $50,000. During this time, traders who employed a combination of 50-day and 200-day MAs experienced:
- A notable price surge in January when the 50-day MA crossed above the 200-day MA, signaling a prolonged uptrend.
- A subsequent decline in March when the 50-day MA crossed below the 200-day MA, indicating a downtrend.
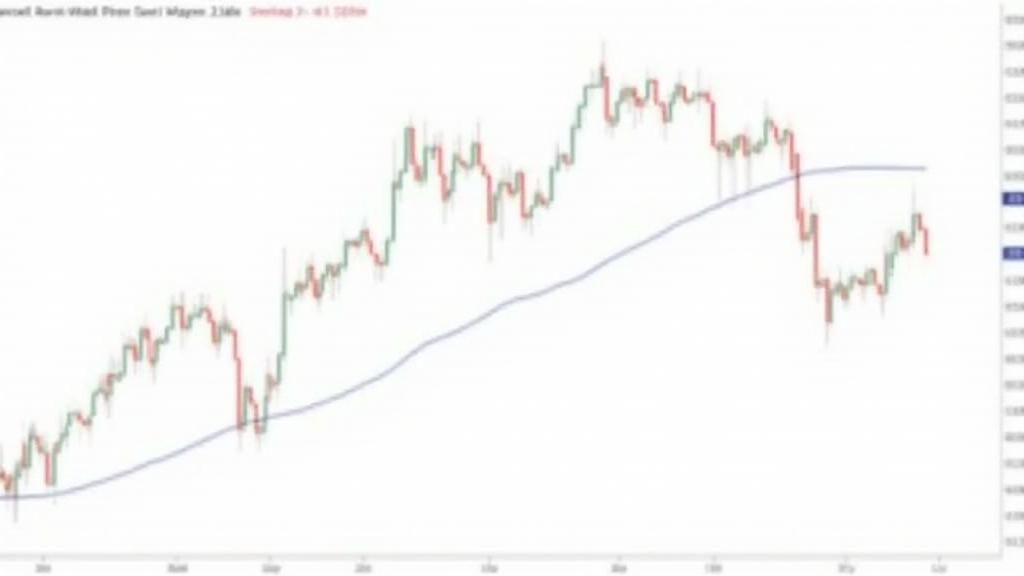
Chart Example
Below is a chart illustrating Bitcoin’s price movements alongside the SMA and EMA, showcasing the interplay between different moving averages:

Market Insights: Bitcoin and Vietnam
As Bitcoin trading continues to grow globally, Vietnam has seen a remarkable increase in its crypto user base. According to CoinMarketCap, Vietnam’s crypto users grew by a staggering 200% in 2024, making it one of the fastest-growing markets. This growth underscores the importance of education around tools like moving averages for Bitcoin price.
Conclusion
Understanding moving averages for Bitcoin price can provide traders with powerful tools to analyze market trends and make informed decisions. By incorporating both SMA and EMA into your trading strategies, you can enhance your approach to cryptocurrency trading. Always remember to stay updated with market trends and combine your strategies with other indicators for maximum effectiveness.
For more insights on cryptocurrency trading and analysis, explore additional resources at hibt.com. Remember, trading cryptocurrencies involves risks. Consult local regulators, and don’t take financial advice from unknown sources.
By prioritizing moving averages in your trading strategy, you’re better equipped to navigate the dynamic world of Bitcoin and beyond. Keep abreast of the latest developments, and enjoy your trading journey!
Author: Dr. Jane Doe
Dr. Jane Doe has authored over 15 papers in the field of blockchain technology and has led the auditing of multiple well-known projects. She is a recognized authority in crypto trading and market analysis.

